hist(mtcars$mpg)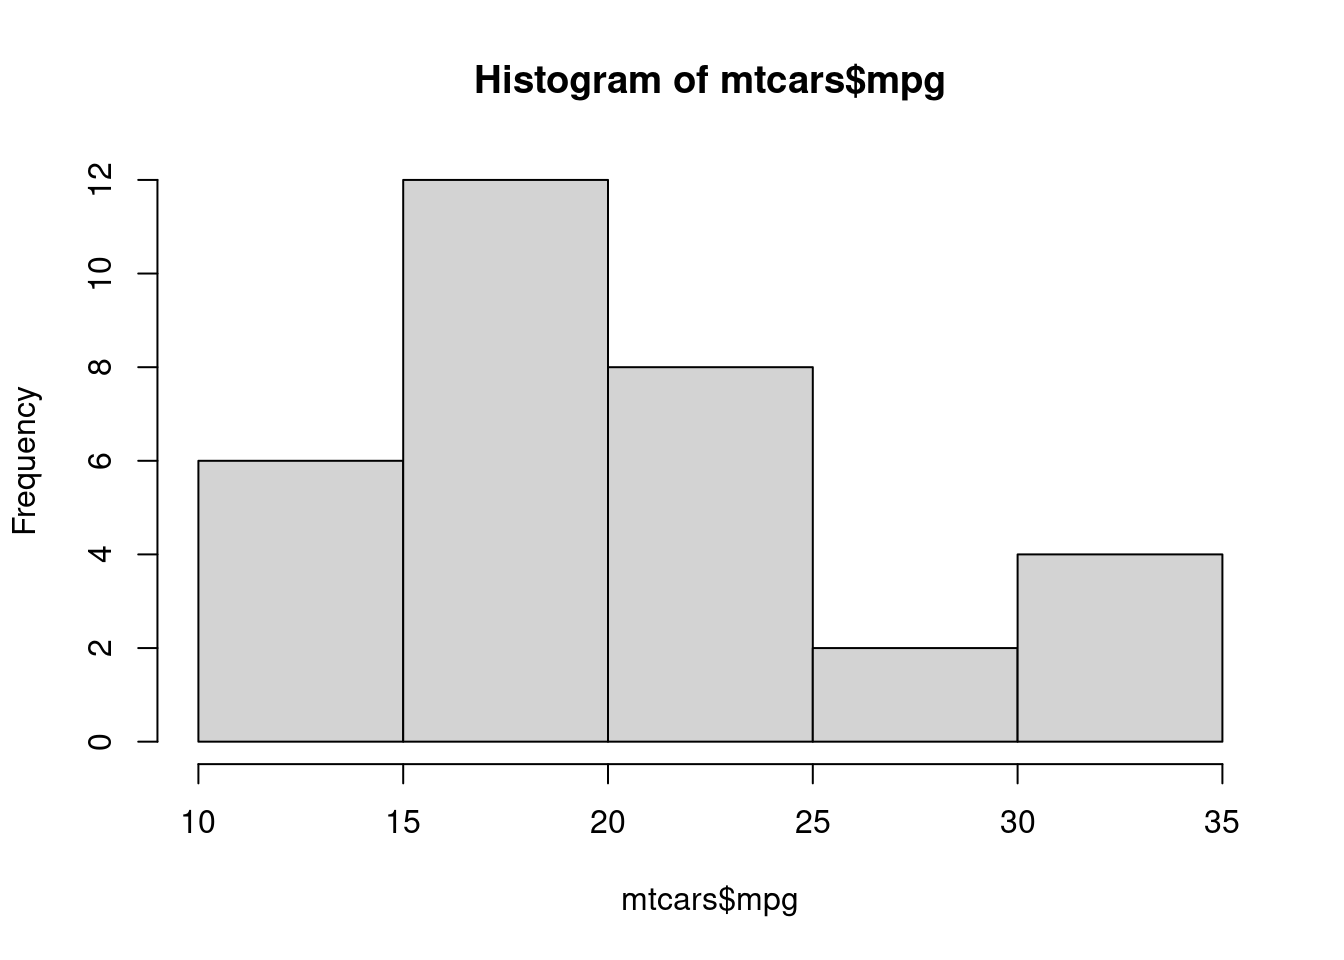
This will tell you all about the topic.
Here is some R code.
hist(mtcars$mpg)
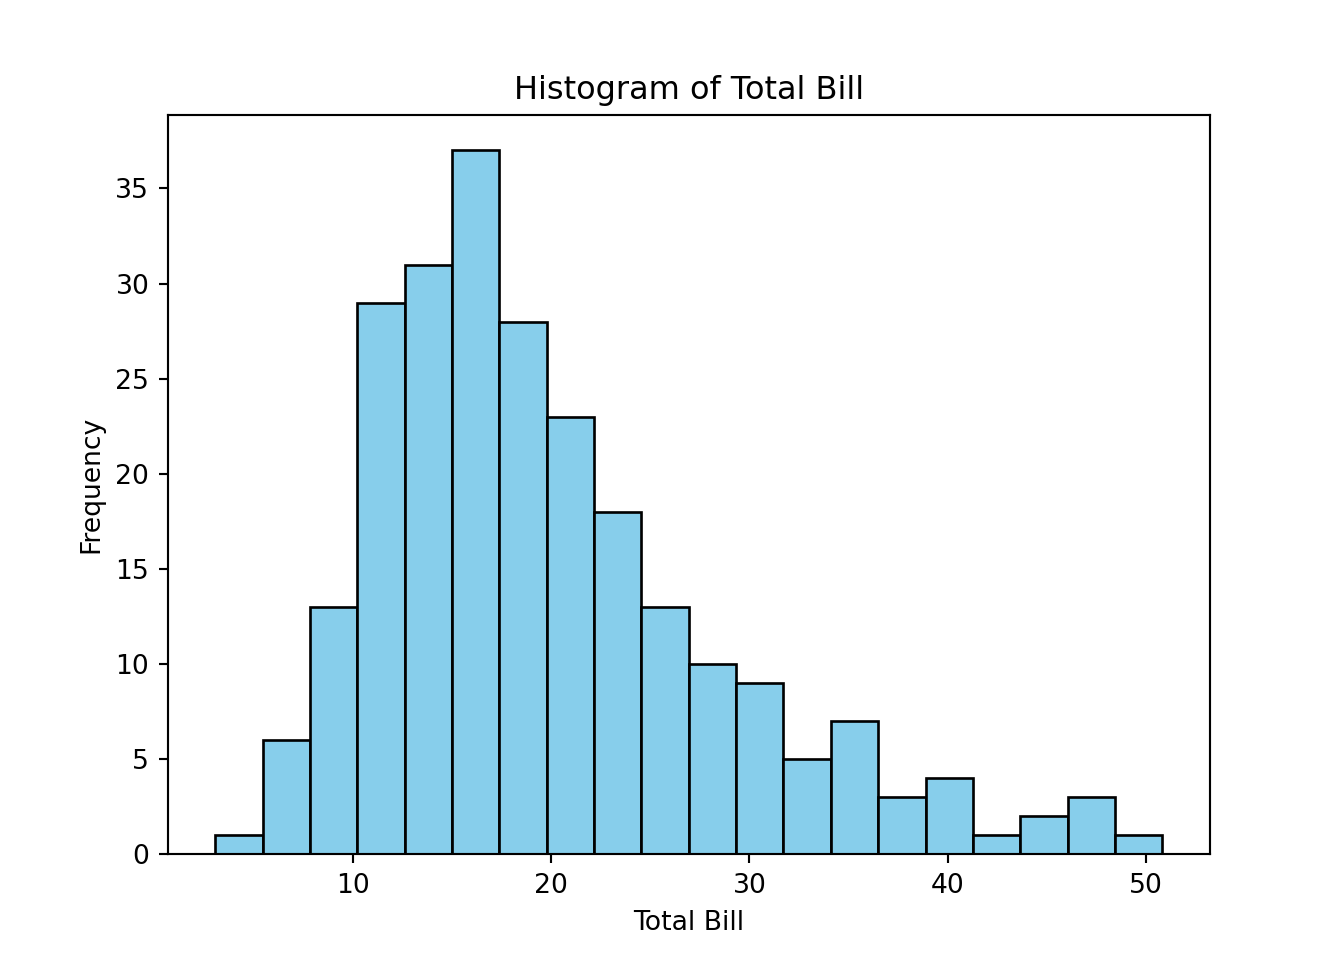
Here is some python code.
import seaborn as sns
import matplotlib.pyplot as plt

tips = sns.load_dataset("tips")

plt.hist(tips["total_bill"] , bins = 20, color = "skyblue", edgecolor="black")
plt.title("Histogram of Total Bill")
plt.xlabel("Total Bill")
plt.ylabel("Frequency")
plt.show()